As part of Creative Spin Studios INTRO exhibition, I thought I’d take the opportunity to create some new work influenced by my role as Senior Photographer and Lead in Advanced Imaging at The john Rylands Research Institute and Library, University of Manchester, (yes that is a mouthful) and my own photographic practice with historical and analogue processes.
Some of you will know that I rarely exhibit my work, having difficulty describing myself as either photographer or artist, and more of a practitioner. So being asked to provide an Artists Statement was the first challenge. So here it is… thanks to AI and ChatGPT for its helpful contribution.
The relationship between Science, Photography and Art is a dynamic interplay that has evolved since the advent of photography in the 19th Century. Each discipline enriches and informs the others in various ways, creating a symbiotic relationship that advances our understanding and appreciation of the natural and imagined world.
This new work by Photographer Tony Richards, using the latest Computed Tomography (CT) scan techniques and data visualisation, alongside early analogue photographic methods. Demonstrating Tony’s interest in photography as a tool for scientific imaging and documentation, and as a medium for artistic expression and creativity.
The relationship between Science, photography and art has been well documented over the years so I’ll not write an essay about it here. Although I can thoroughly recommend Photography and Science by Kelley Wilder 2009.
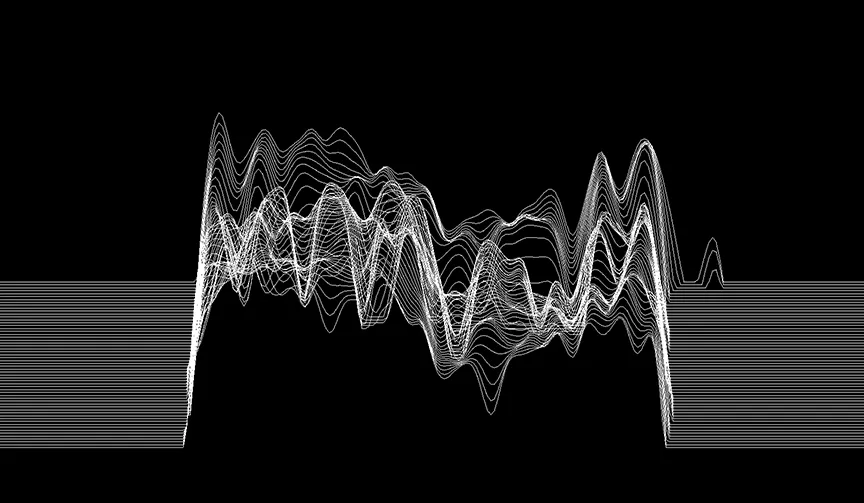
I first began to look at other methods of data visualisation during the Covid pandemic lockdown, using opensource Fiji/ImageJ software and multispectral imaging data of the Saint John Fragment to give a nod to Joy Divisions iconic album cover design “Unknown Pleasures”. (Blog post link)
Then in September 2023 we were able to CT (Computed Tomography) scan some of our Special Collections items, including Gaster Amulet 34A, at the University of Manchester NXCT centre. We had always assumed these facilities were exclusive to medical research but collaborations are possible for all forms of research within the University and beyond. You can read more about that here. (Blog post link).
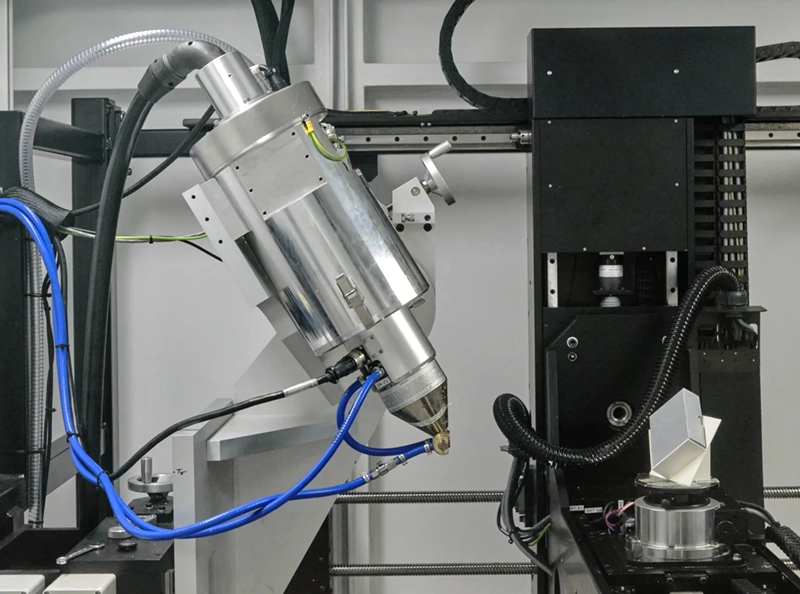
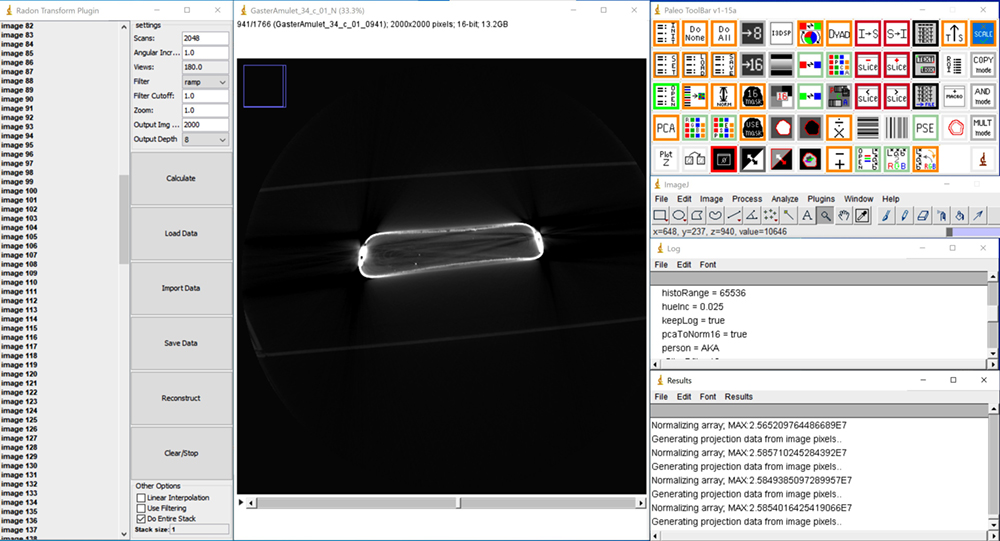
As with all new digital imaging methods comes a very steep learning curve in both vocabulary and software processing. Mathematics was never my strong point, and now I wish I had paid a lot more attention at school, just to be able to understand the very basics of this new process. I am fairly confident in navigating my way around ImageJ, as we use it for our multispectral imaging processing and analysis but this is the first time I’ve imported 3D CT data. Other software’s available are Drishti, Slicer and Avizo, to name just a few. Some of these medical imaging resources are opensource and free and others incredibly expensive.
Below you can see the ImageJ software running through the high resolution CT data. The Radon Transform being taken here took over 12 hours of intense processing.
So, what is Radon Transform?
Now that’s a very good question and one I’ve been trying to find a simple answer to, and failing miserably. As I mentioned, I didn’t pay much attention to mathematics as school. And now I’m trying to read post grad research papers trying to understand advanced mathematical theorems and formula. Trying to find an “idiots Guide” to Radon and Fourier Transforms would be great, if you know of one, please get in touch. Take a look at the Wiki page explanation and you’ll see what I mean. What I find fascinating is that in 1917, Austrian mathematician Johann Radon, demonstrated that the image of a three-dimensional object can be constructed from an infinite number of two-dimensional images of the object. Decades later this work was applied with the invention of the CT scanner.
Here’s an animation of the CT slice data, that’s 2,026 individual scanned high resolution tiff images.
If the videos do not load at first, please refresh you screens/browsers (thank you)
And here is a Sinogram of the Radon Transform of the CT data above. A sinogram is a collection of projections at several angles, which is a linear transform of the original image… a really helpful blog post here. There is an inherent aesthetic quality to the data’s visual representation as a Sinogram.
This sinogram animation also helps in explaining what’s going on…. I hope.
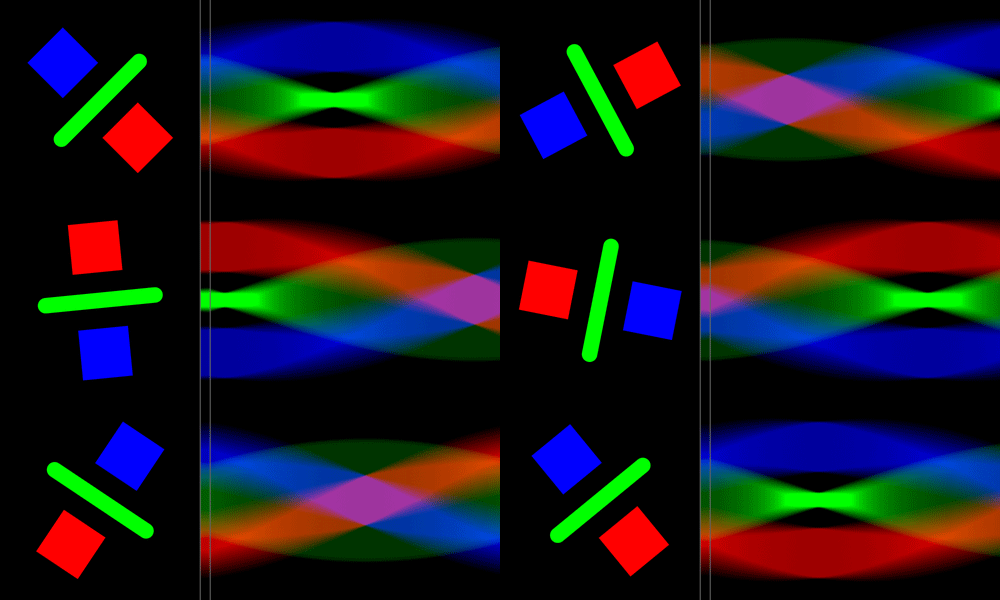
Radon Transform Sinogram example by LucasVB
From these Radon Transform sinograms I can produce high quality inkjet prints from the Central Slice, which I then flat copy onto Agfa X-ray film as an internegative. This allowed me to adjust the negative densities through exposure/development to acquire a film negative suitable for various analogue printing methods. This x-ray film is coated on both sides and easily scratched during processing. I must have gotten through a quarter of the box to get a variety of minimally scratched negatives at different density, contrast and size for my needs, which were a little unknown at the time.
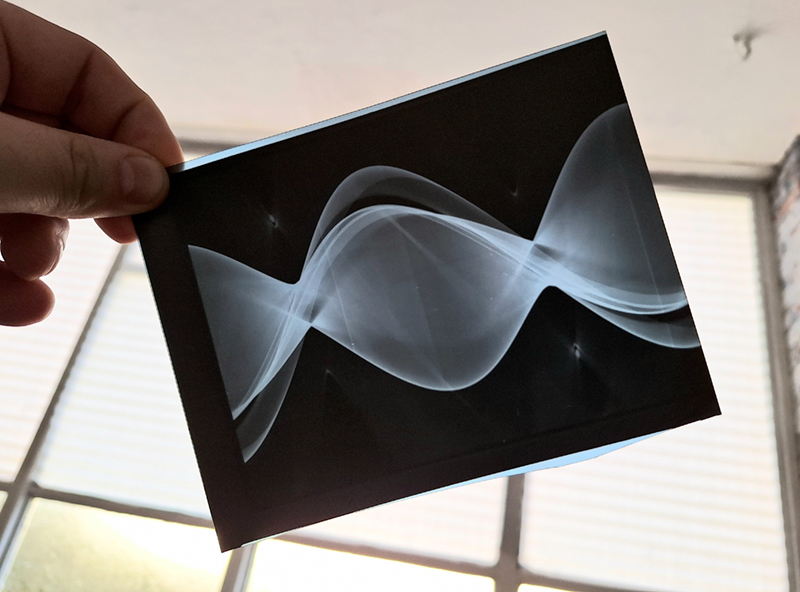
My first thoughts were reproducing the images via Bromoil printing, a method I’ve been getting to grips with the past few years . Bromoil was invented in 1907 and was used by many photographers during the first half of the 20th century and gained great popularity with those interested in Pictorialism and by the members of the Linked Ring.
The Bromoil process:
A traditional darkroom silver gelatine print is made by contact printing under a darkroom enlarger, it is then chemically bleached and tanned, fixed again and washed, the remaining ghost of an image is called a Matrix. The paper is soaked again and ink applied by hand via brush, roller or sponge. Where there was silver (dark areas) there is less gelatine swelling due to the tanning stage, so the ink sticks to the paper, where there was less or no silver the gelatine swells and repels the ink, resulting in the differing contrast and shades that make up the image. It a laborious and time consuming process but well worth the effort.
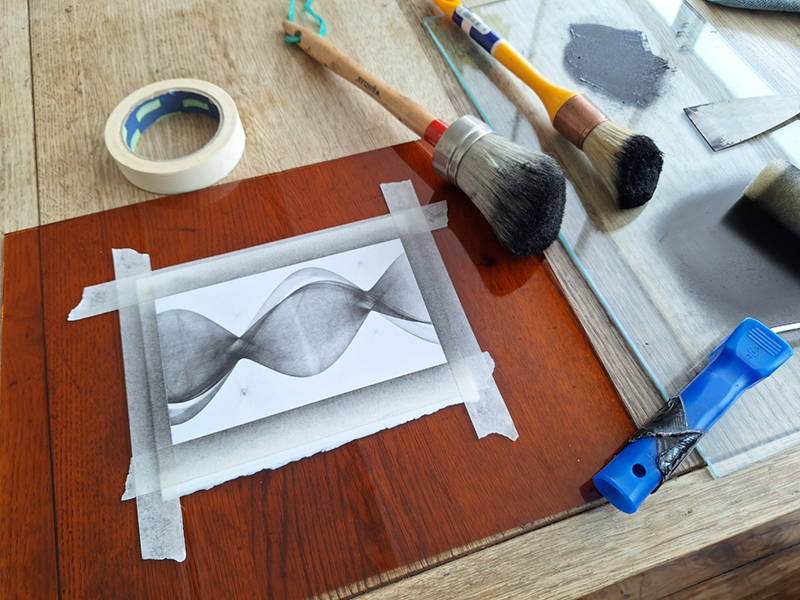
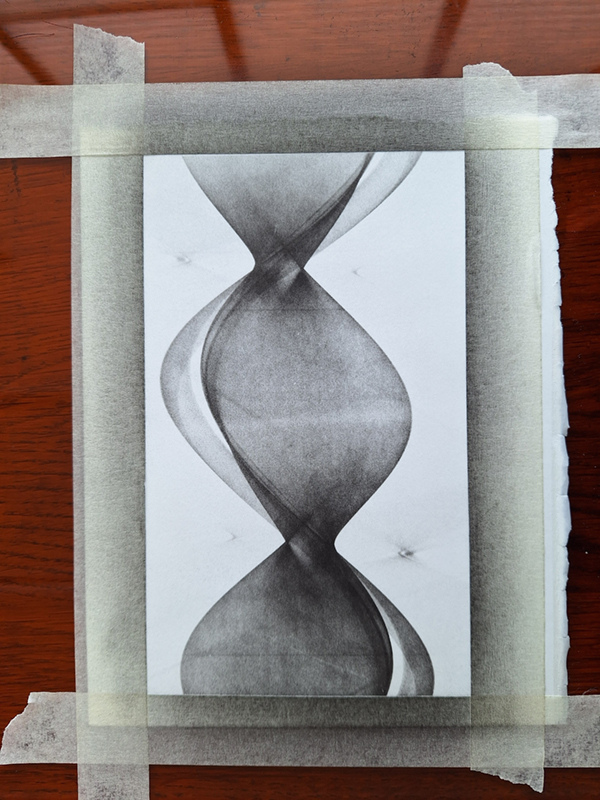
Then after reading further about Johann Radon and his theory, I thought it might be more appropriate to give a nod to another pioneer and scientist, William Fox Talbot, inventor of the Calotype and Salt Print. So, I took some time to create another set of X-Ray negatives for use with the salt printing process.
The Salt Print:
Fabriano 5 HP paper is floated on a dish of sea salt solution and dried. It is then coated with a Silver Nitrate solution with a hake brush, other methods include glass rod and float coating, and the paper is left to dry in a dark room. When dry it is contact printed against the negative, in this case for one hour under the darkened skies of Leigh, until a dark warm purple/brown print is achieved. It is then washed with water in the darkroom for a good ten minutes until the water runs clear, it is then fixed in a weak solution of Ilford Hypam for 3-5 minutes, then into a tray of Hypo Clear for another three minutes, and then thoroughly washed for another 30 minutes until left to dry. It should dry a darker brown/black colour. These are un toned, toning with gold or selenium is a popular step prior to fixing.

For this exhibition I have two prints of the same image, both different stylistically and slightly different sizes, due to the somewhat experimental workflows I follow. The Bromoil print, in ink, is more sketch like and graphic, whereas the Salt print has great tonality and warmth. Although I work mainly in the wet plate collodion process I find myself experimenting with other processes more and more. The QR code attached to my exhibition text panel with bring you to this blog post.
If you manage to get to the exhibition please do let me know what you think. Or if this blog post or social media is your only connection, then all feedback is appreciated.
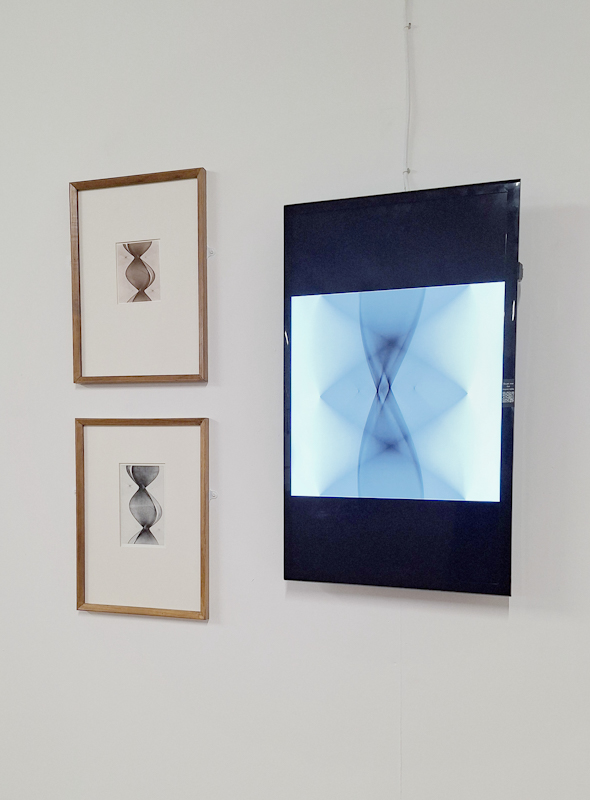
These prints are the first steps into my journey working with data revisualisation within my own practice in combination with my digital work as Senior Photographer at JRRIL. Science, Photography and Art informing and influencing each other. My next steps are reproducing quasi CT data through other imaging methods and revisualising the results in analogue printing processes. I have two or three exciting methods in mind that should produce useable and very interesting results.
My thanks to JRRIL and University of Manchester for the use of the CT data. And to Derek and Angie for the exhibition install.
beautiful work, and a very nice process overall!
Thank you